
WinDbg reveals the real reason behind Windows crashes when built-in tools fall short
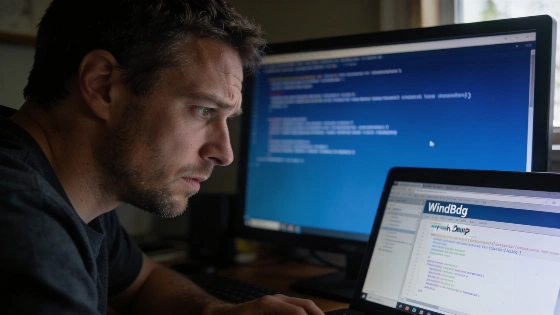
Most people see a blue screen and a stop code when Windows crashes. The message is cryptic. The cause is hidden. Event Viewer, Reliability Monitor, and the crash screen all promise help. They rarely deliver. Usually, you get a generic code and little else. The real culprit-a faulty driver or component-stays in the dark.
I wanted to see how these tools really work. So I crashed Windows three ways inside a Windows 11 VirtualBox VM. I used NotMyFault from Microsoft's Sysinternals suite. This tool forces system crashes on demand. I triggered a High IRQL fault (classic driver crash), a buffer overflow (memory corruption), and a stack trash (call stack corruption). Each crash exposed a different flaw in Windows' default reporting.
Microsoft recommends correlating the time of a blue screen with system event logs: Event ID 41 indicates a restart without proper shutdown, Event ID 6008 signals an unexpected shutdown, and Event ID 1074 marks a restart initiated by an application or user.
Why built-in crash tools miss the mark
Before each crash, I set Windows to save small memory dumps and turned off automatic restart. That way, the crash screen stayed up. Sometimes, the crash screen showed a "What failed" line. It named myfault.sys for two out of three crashes. But on the stack corruption (stop code 0x139), it gave only the code. No driver. No clue. Most users never see even this. Windows restarts by default. The info vanishes. Nothing saves it for later.
Reliability Monitor is supposed to help with slowdowns or instability. It logged every crash. But it split each one into three confusing entries. Clicking for details showed only the stop code, its parameters, and the dump file name. Never the real cause. Never the driver. Event Viewer was no better. It buried the key Event 1001 (BugCheck) among generic shutdown logs. Even after filtering, it gave the same limited info as Reliability Monitor.
All these tools point to one thing: the dump file. But none can read it for you. They confirm a crash happened and tell you where to find the dump. They never explain why it happened or who is at fault. Microsoft says minidump files are usually in C:\Windows\Minidump. These files are needed for real crash analysis. Built-in tools can't go further. For more, see the Microsoft Learn Q&A discussion.
WinDbg gives the answers built-in tools can't
WinDbg is a Microsoft tool. It's not pre-installed, but you can get it free from the Microsoft Store or with winget. WinDbg reads the minidump file. It shows the real cause of the crash. In every test, WinDbg named the guilty driver-myfault.sys-every time. On the stack corruption crash, where other tools failed, WinDbg gave a plain answer: stack-based buffer overrun. That matched the simulated failure exactly.
WinDbg is easier than it looks. Install it. Run as admin. Open the minidump (usually in C:\Windows\Minidump). Run !analyze -v. Three lines matter: BUGCHECK_CODE (the stop code), IMAGE_NAME (the crashing driver), and ERROR_CODE (the plain-language cause, if available). The first time, WinDbg needs an internet connection to get debugging symbols from Microsoft. For the buffer overflow test, Driver Verifier's Special Pool check caught the corruption at its source. Even without Driver Verifier, WinDbg still found the real cause. No built-in tool did that.
Microsoft recommends that after hardware or driver failures, users should check dump files, run Windows Memory Diagnostics, and review the 'MemoryDiagnostics-Results' entry in the System log. This approach extends diagnostics beyond a single stop code and can help pinpoint underlying issues.
There are limits. If small memory dumps aren't enabled, WinDbg can't help. In real crashes without Driver Verifier, memory corruption can sometimes point to the wrong driver. Still, WinDbg is the only tool that reliably turns a crash dump into real answers.
What to do after a crash
If you want to diagnose Windows crashes, do this: keep small memory dumps enabled (System Properties > Advanced > Startup and Recovery > Settings). Install WinDbg. When your PC crashes, skip the built-in tools. Go straight to the dump file. Only then will you see the real answer-often a specific driver or component. No more guessing.
Windows crash bugs are nothing new. As reported earlier, even old apps can crash the system under the right conditions. The difference between endless troubleshooting and a quick fix is simple. You need the right tool. WinDbg is not just for developers. Power users need it too. The built-in tools log the crash. Only WinDbg tells you what really happened. If you want to stop guessing and start fixing, this is the answer.