
Enjoying the benefits of small price action can be a lucrative game – if it is played correctly. Especially in day trading, it can be dangerous for the novice or anyone who doesn’t have a well-thought strategy.
If you want to excel at day trading, it is good to find reliable support and resistance. Many sites like FX Trading Master assist the new traders starting their journey on day trading.
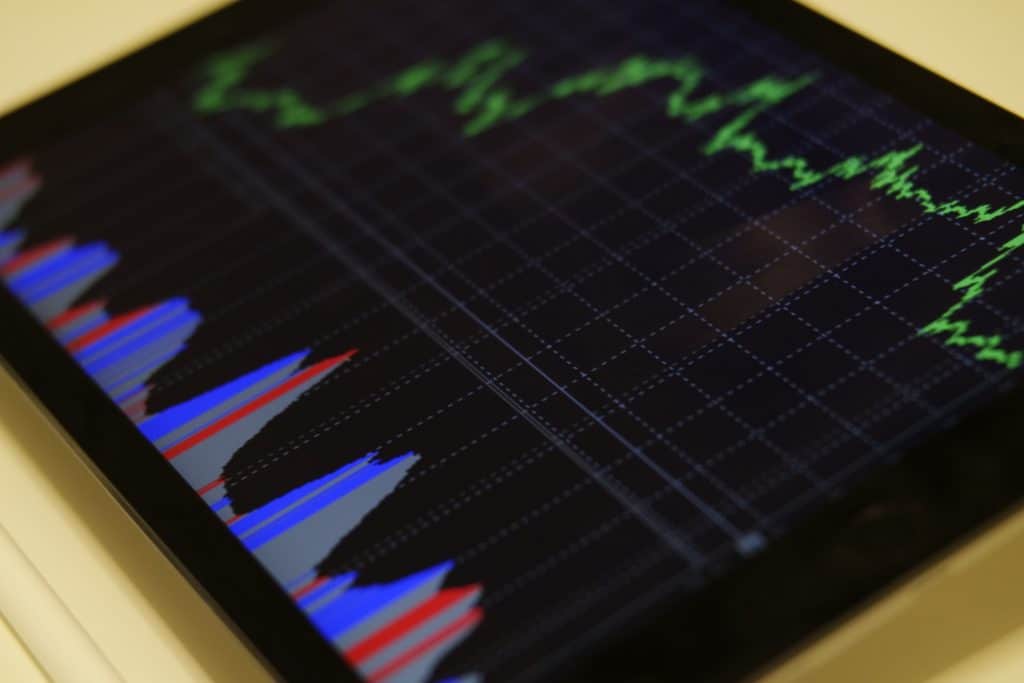
Support and resistance – these two are critical for entering new trades as well as for-profits. An area of support is where the asset price tends to stop falling. Likewise, an area of resistance is where the asset prices stop rising.
However, a professional trader needs to know more beyond this simple definition of support and resistance. Before you attempt to make a trading decision, you must learn to find reliable support and resistance.
This article will guide you to find support and resistance zones for your trading plan. Let’s start from the beginning.
What Are Support and Resistance?
The concept of support and resistance levels are two popular attributes in the forex market. Support and resistance refer to the levels where a financial asset hardly passes through.
- The support level is where the demand is considered to be so strong that it prevents an asset price from getting low. It can be denoted as the level where a financial asset or currency struggles to pass below.
What is the logic behind it?
The buyers and sellers become more inclined to buy and sell when an asset price tends to fall. When the price approaches the support level, it is assumed that the demand will exceed the supply.
- The resistance level is where selling is supposedly extreme, that it prevents the asset price from moving higher. When an asset price climbs towards the resistance level, the buyers become less inclined to buy, and the sellers become more willing to sell.
Forex market traders observe patterns to predict what will happen in the future. As part of the chart pattern analysis, these terms are used mainly by day traders.
They use to refer it to refer to chart price levels that act as a barrier. Also, these terms prevent the asset price from getting pushed in a specific direction.
How to Find Support and Resistance in Day Trading?
Support and resistance come in various forms. So there are several ways to find it. Though it seems easy, in reality, it is more difficult to find trustworthy support and resistance.
For the best result, we’ve focused on price action and trading volume. Price action refers to the movement of the price of security planned over time. Besides, volume denotes the sum of trades that brokers use to determine the size of a customer.
Below we discussed some methods based on price action and volume.
- Swing Highs and Swing Lows
In the financial markets, swings are caused by increased instability. It is visible when the price of specific security goes through a fast and directional change in value. Tracking the market swings means you follow the defining points of price action.
These turning points of price action are the result of the market being prevented or supported. It is essential to observe the market swings to identify support and resistance levels. At the same time, you must be able to draw swing highs and swing lows.
Then you need to study an objective method for labeling swings to ensure consistency. Many new traders know little about drawing swing highs and lows. In the end, they lack the rule for marking out swing highs and lows.
- Tremendously High Trading Volume
A high volume refers to the volume exceeding the long-term volume by a minimum of three standard deviations. When you are in search of market interest, you must consider trading volume.
You contribute to the trading volume when you trade in the market. It means that volume is a potent market interest indicator. However, you should check price bars with very high trading volume. Then, use the price bars to plan support and resistance.
- Congestion Areas
A congestion area is a group of prices where there has been too much trading in the past. When you see the market congests in a price range, understand that the market is interested in this range. The areas with past congestion become more significant support and resistance.
- Price-Gaps
Price gaps denote the sharp breaks in price where there is no trading in between. These gaps generate a vacuum. If the trades aim to buy or sell in between the price gaps, they miss their opportunity.
Then they wait for another chance. They can grab that second chance when the market comes back to the price gap. At that time, they can send their trading orders. Doing this creates the possibility for support and resistance levels.
Wrapping Up
Knowing the market interest is essential for finding the support and resistance. You need to find the price zones where the market is keen. Above, we mentioned a couple of ways to find reliable support and resistance. It is better to stick with a particular way to find it.
However, it is not enough to find support and resistance for a trading strategy. Observe how the price behaves. Also, consider market instability and price action around the support and resistance.