
Today’s article is dedicated to all those users who’s looking for some of the best Online tools to Create Infographics. So must try this opinion piece covered by us.
We all know that visual representation speaks more than words written on paper and slideshow. The reason, is that it’s very easy to convey knowledge and engage its viewers. And due to which these Infographic things are very popular among users and creating lots of heat. I’m a blogger and know its importance in today life.
Ok, let me ask one you one question, Out of full-length 1000-word article and one Infographinc which one you like to choose of go with. Offcorse Infographic, and the reason is that a user will take 5-7 min to read the whole article and still he will under 50-60% of the thing mentioned. But if Infographic needs a few scrolls-downs and banggg! You get all the thing what a writer wants to tell you.
So would you like to make your own Infographics and looking for some platform to make that thing happen then this article is surely your cup of tea. As making Infographic is not an easy thing to do, but in this article we are going to share with some of the Best Online Services To Create Your Own Infographics for free.
1. Wordle
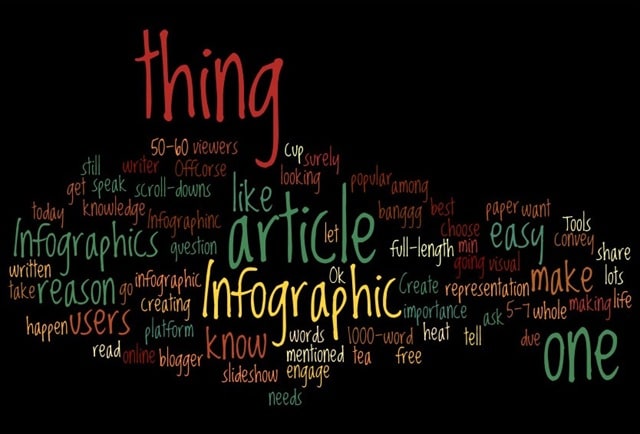
Wordle is one of the best web app using which you can create beautiful and fully customizable word clouds Infographic just with few clicks. All you have to do is simply paste the words which you want to show in your visual representation or you can add the url of the particular article and submit it and you are done. What you will get is shown above in the snapshot. You can also publish your created Infographic over the web.
2. Visual.ly
Visual.ly is another online tool which empowers people to tell stories with data. Using this website you can create Infographics just by picking up a particular design and template some of them are Facebook Insights, Facebook Monsterizer, Twitter showdown, twitterize yourself and lots more upcoming daily. But to create one you have to register with this free web service.
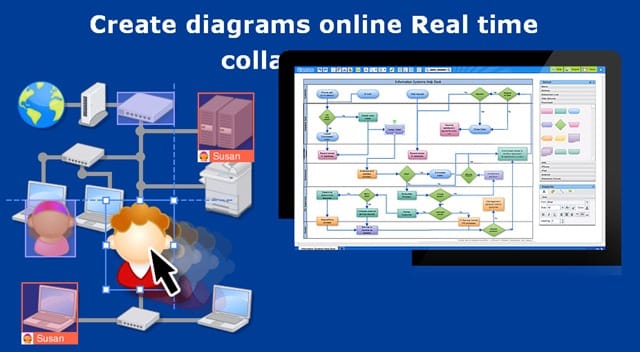
3. Creately
Using Creately you can build organized concept maps, flowcharts, and diagrams for free. Basically these have a subscription pack, but still free member can create up to 5 Infographics for free. I’m sure if you are using creatly, then you can easily draw diagrams online. You can also use these diagrammatic tools to draw any diagram type now using free templates and examples.
4. Visualize.me
This is another cool website using which you can create amazing and beautiful Infographics. One thing which I really like about this web app is that you can register this website using your Linkedin profile and guess what, you can convert your LinkedIn profile into a beautiful Infographic in one click. The man of this website is to change the traditional text resume representation which is boring, long and long overdue for a makeover. One thing which you don’t like about this tool is that you can’t save created a portfolio on your hard disk, the only option to get that is printed out.
5. Tagxedo
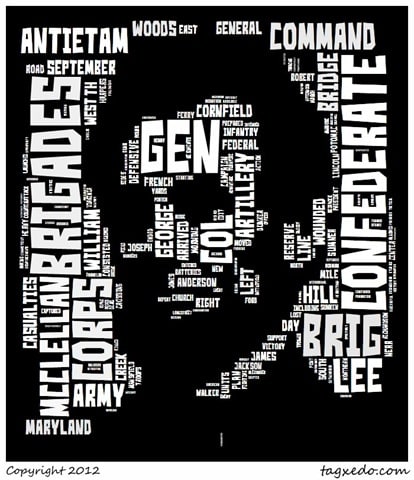
Tagxedo turns words into famous speeches, news articles, slogans and themes, even your love letters into a visually stunning word cloud, words individually sized appropriately to highlight the frequencies of occurrence within the body of the text.
6. Piktochart

Its an amazing web service using which you can represent your Information beautifully by Creating Infographics. Three features which I really like about this website are powerful editor, professional design and its very easy to use.
7. Infogr.am
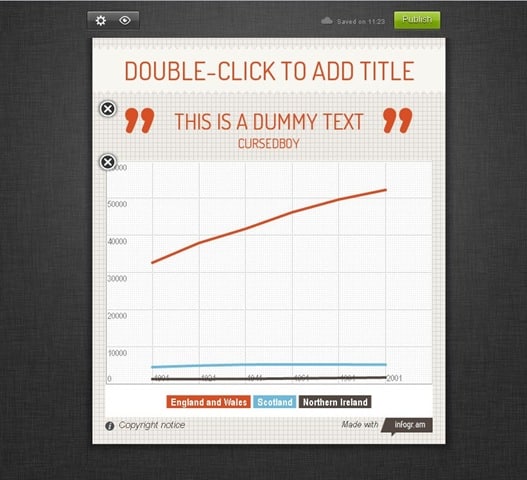
Using this website you can create Infographics and interactive online charts. One thing you will like about this website is that it’s free and super-easy. Here you can also follow other users and discover amazing data stories!
8. Online Charts Builder – HoHli
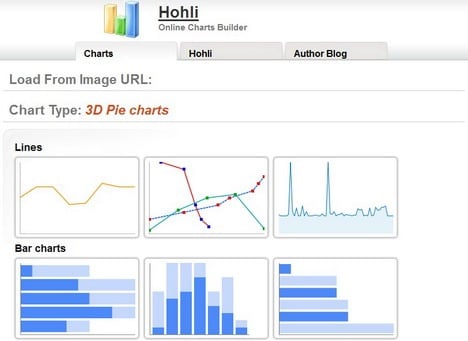
Online Charts Builder based on the Google Charts API, using which you can 3D Pie charts, lines, bar and pie charts, Venn diagrams, radar charts and scatter plots and more. You can also change chart size according to your desires.
9. Icon Archive
10. Google Chart Tool
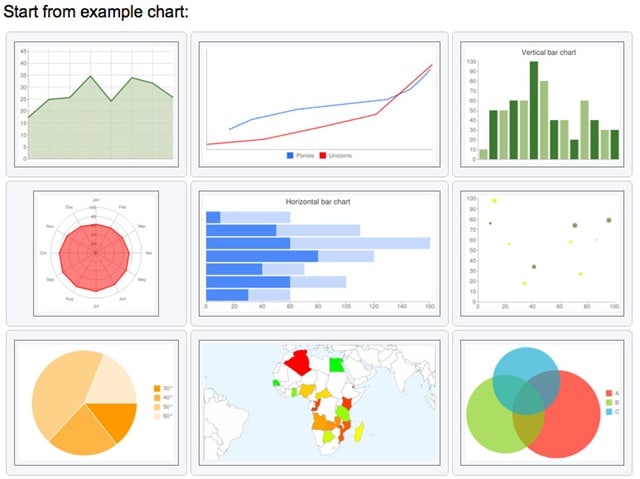
Google chart tools are powerful, simple to use, and free. Try out our rich gallery of interactive charts and data tools.
11. amCharts Visual Editor
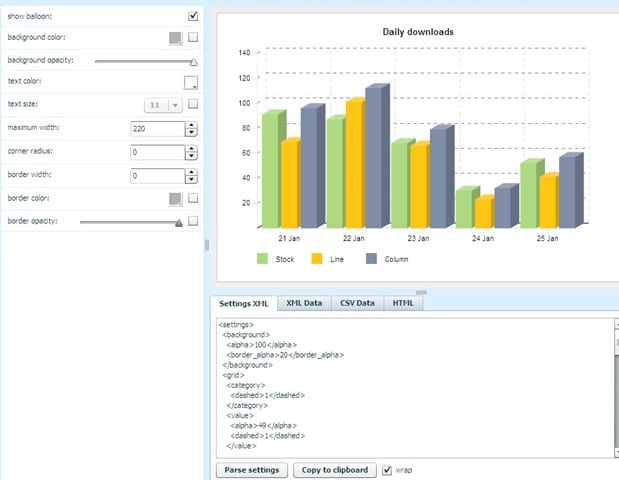
Visual editor helps to create settings and data files suitable for Flash charts (bundle and stock). It won’t produce code if you are working with JavaScript charts only. Basically its ideal tool to generate charts for your interactive Infographics.
12. Dipity
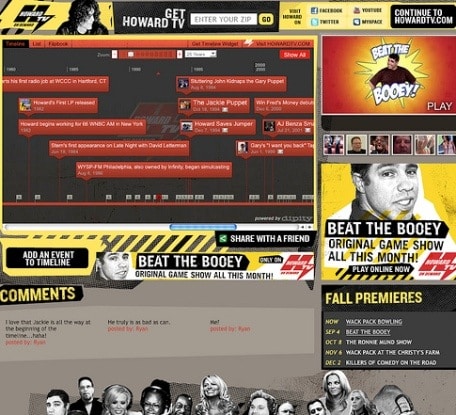
Using this you can create an interactive, visually engaging timeline in minutes. Use dynamic visualization tools to display photos, videos, news and blogs in chronological order.
13. Easel.ly
Use Easel.ly to create your visual ideas, basically vhemes are visual themes. Drag and drop a vheme onto your canvas for easy creation of your visual idea!
14. Venngage
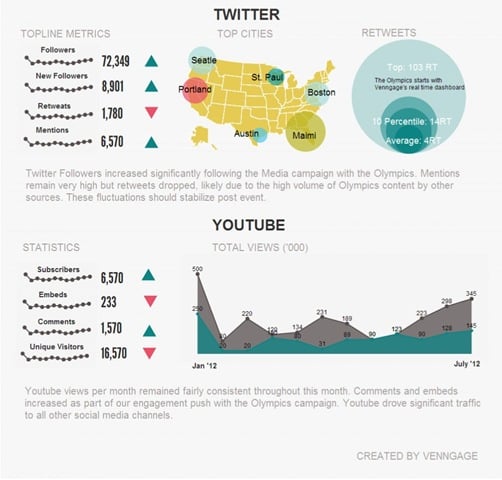
Venngage will transform your boring data into stunning Infographic reports. One thing which I really like about this web service is that you can also check who is viewing your created Infographic.
15. Gliffy
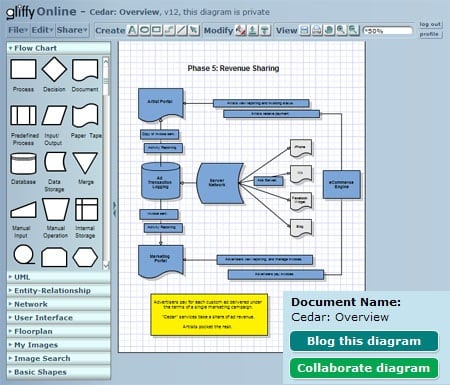
Gliffy is a web-based diagram editor using which you can create and share flowcharts, network diagrams, floor plans, user interface designs and other drawings online.
16. What About Me?
Create an Infographic of your digital life and become inspired by the people you know, the things you see, and the experiences you have online. This will automatically create the Infographic of your social media behavior on Facebook, Twitter and YouTube. And guess what this tool is provided by Intel that mean quality for sure.
17. Many Eyes
Many Eyes is as an experiment brought to you by IBM Research and the IBM Cognos software group. Using this site users is allowed to upload data and then produce graphic representations for others to view and comment upon.
18. iCharts
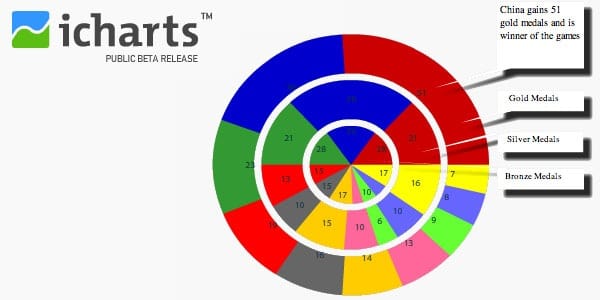
iCharts is a cloud-based charting tool that makes it easy to visualize, share and distribute data. It accelerates data-driven storytelling with interactive charts for publishers, marketers, journalists, bloggers, and market researchers.
19. Timeline JS
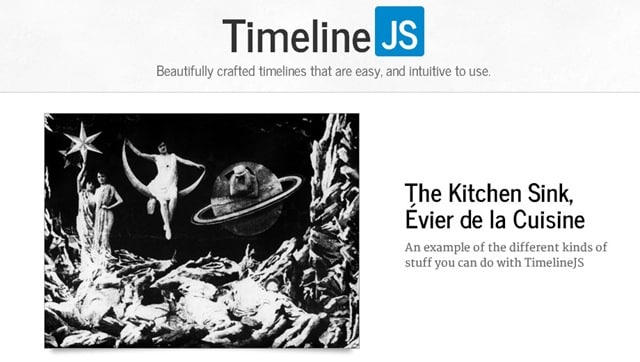
TimelineJS is an amazing web service which can pull in media from different sources. Basically this web service is built in support for Twitter, Flickr, Google Maps, YouTube, Vimeo, Dailymotion, Wikipedia, SoundCloud and more media types in the future. Using this service creating one is as easy as filling in a Google spreadsheet or as detailed as JSON.
20. StatSilk
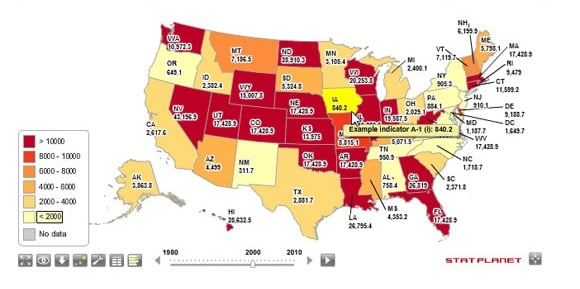
Create interactive maps using the award-winning free StatPlanet software. Explore thousands of world stats through interactive maps and data visualizations.
21.Chartsbin
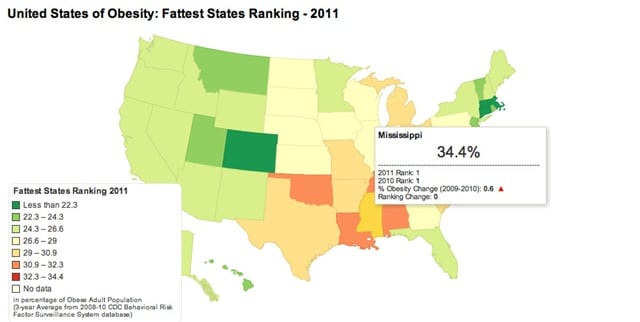
Using this website you can create interactive maps online instantly! No installation required. No coding needed.
22. Bubbl.us
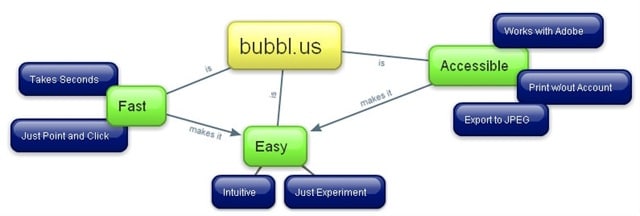
Using Bubbl.us you can easily create colorful mindmaps to print or share with others. Almost no learning curve.
23. Cacoo
Cacoo is a user friendly online drawing tool that allows you to create a variety of diagrams such as site maps, wire frames, UML and network charts. Cacoo can be used free of charge.
24. Chartle.net
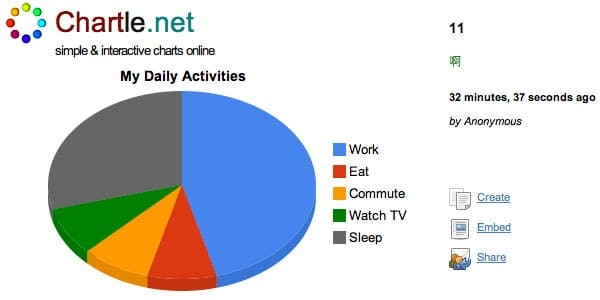
Chartle.net is another cool browser based tool using which you can slick-looking charts & graphs easily using a variety of pre-built templates like US Map, Venn Diagram, and many others. Publish, share & embed.
25. Mindomo
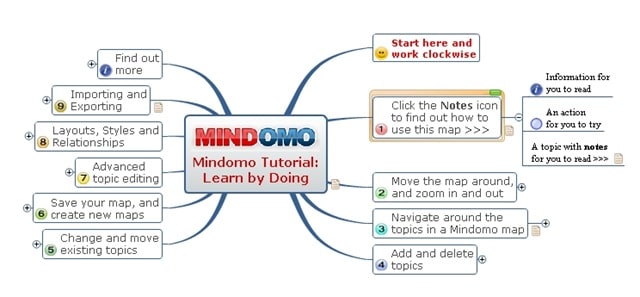
Create the best looking mind map online and share it to others. Enjoy mind mapping by brainstorming collaboratively on ideas and projects.
26. Edraw Infographic:
There are lots more, but I don’t want to add junk to my list. These are 26 best online tool or websites which I found are best to Create Your Own Infographics. But if you feel I forget to share any good name comment section is all yours. Also, don’t forget to share with us which one you are already using.